8 A/B Testing Examples: Strategies Behind the Wins
Explore 8 real A/B testing examples with hypotheses, variants, results, lessons, and practical tactics you can adapt to your next experiment.
Published on 13 min read
Table of contents
- 1. Obama 2008 Campaign Sign-Up Button and Media Test
- What Makes This Design Worth Copying
- 2. Google's 41 Shades of Blue Link Test
- The Statistical Trap in Multi-Arm Tests
- 3. Bing Ad Headline Extension Test
- Why the Guardrails Matter Here
- 4. HubSpot Red vs. Green Call-to-Action Button Test
- How to Run a Button Test That Teaches You Something
- 5. Netflix Personalized Artwork Test
- The Analysis Most Example Lists Skip
- 6. Booking.com Scarcity and Urgency Messages
- Measure Past the Booking Click
- 7. Ad-to-Landing-Page Message Match (Dynamic Keyword Insertion)
- Where Message Match Tests Go Wrong
- 8. New Versus Returning Visitor Messaging Test
- Read the Segments, Not Just the Average
- A/B Testing Examples: Side-by-Side Comparison
- Turn These Examples Into Your Next Winning Test
- Decide What Would Make You Act
Copy the winning button color. Copy the winning headline. That popular advice is exactly how teams waste traffic. A result from another site tells you what happened for that audience, offer, and page layout. It doesn't tell you what'll work for yours.
The best A/B tests reveal more than a winning variant. They show a clear business hypothesis, one meaningful change, a primary metric tied to value, and guardrails that protect trust and experience. When you read A/B testing examples that way, you stop collecting lift percentages and start collecting decision rules you can reuse.
That's the lens for the eight cases below. Some are classic headline and button tests. Others point toward source-level and segment-based personalization, where the average winner may not be the right answer for every visitor. If you want the foundations first, start with A B testing insights from Data Hunters, then come back and judge each example by its design, not its headline claim.
1. Obama 2008 Campaign Sign-Up Button and Media Test
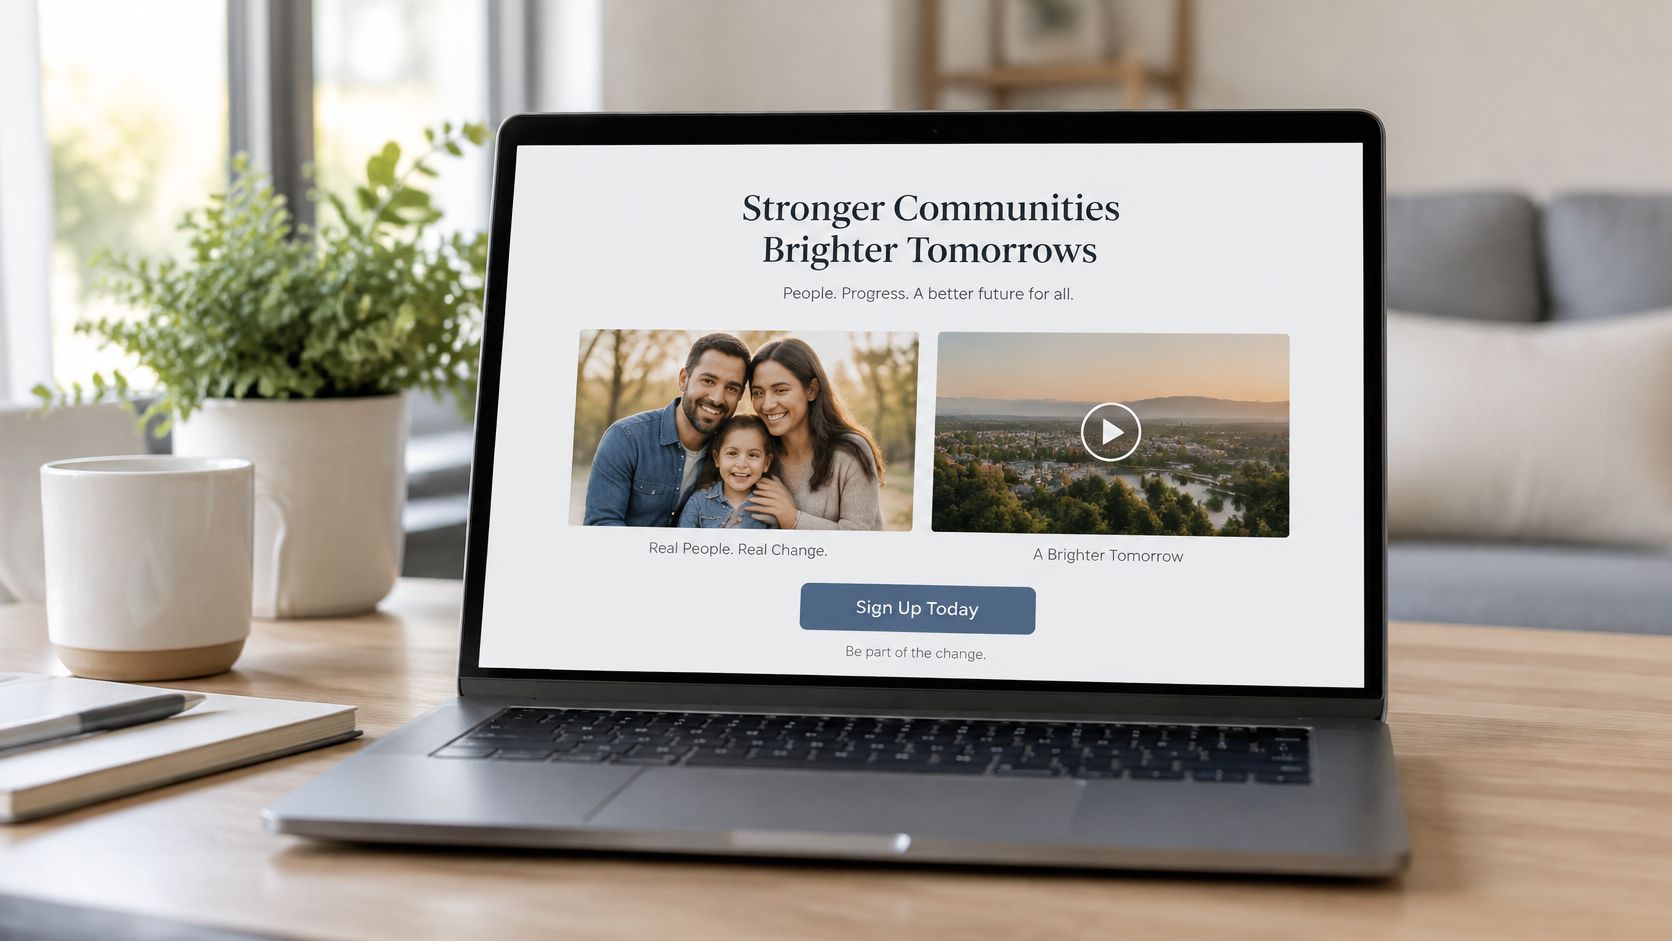
During the 2008 campaign, the Obama team tested combinations of call-to-action button text and hero media on its splash page. Visitors saw labels such as Sign Up, Learn More, Join Us Now, and Sign Up Now, paired with a family photo or video variants. The team measured email sign-up rate as the primary outcome.
The winning combination paired a plain sign-up style CTA with the family photo rather than video. Campaign reporting treated the sign-up gain as a proxy for later donation value, which is the right instinct. A first click matters less than what that supporter does next.
What Makes This Design Worth Copying
This wasn't a simple A versus B test. It was a multivariate test, built to detect whether copy and media interact. A strong CTA with weak media could lose, and weak copy with strong media could hide the better message.
- Budget traffic per combination: Every added cell splits your audience further, so don't launch a matrix you can't power.
- Keep the baseline live: The original page stays in the test so you can separate real lift from novelty.
- Track downstream value: Donations, purchases, or qualified pipeline beat raw sign-ups as a decision metric.
Practical rule: Test copy and media together only when you genuinely suspect an interaction, and write that suspicion down before launch.
The transferable lesson isn't that photos beat video. It's that a page element rarely works alone, and your test design should match how visitors experience the page.
2. Google's 41 Shades of Blue Link Test
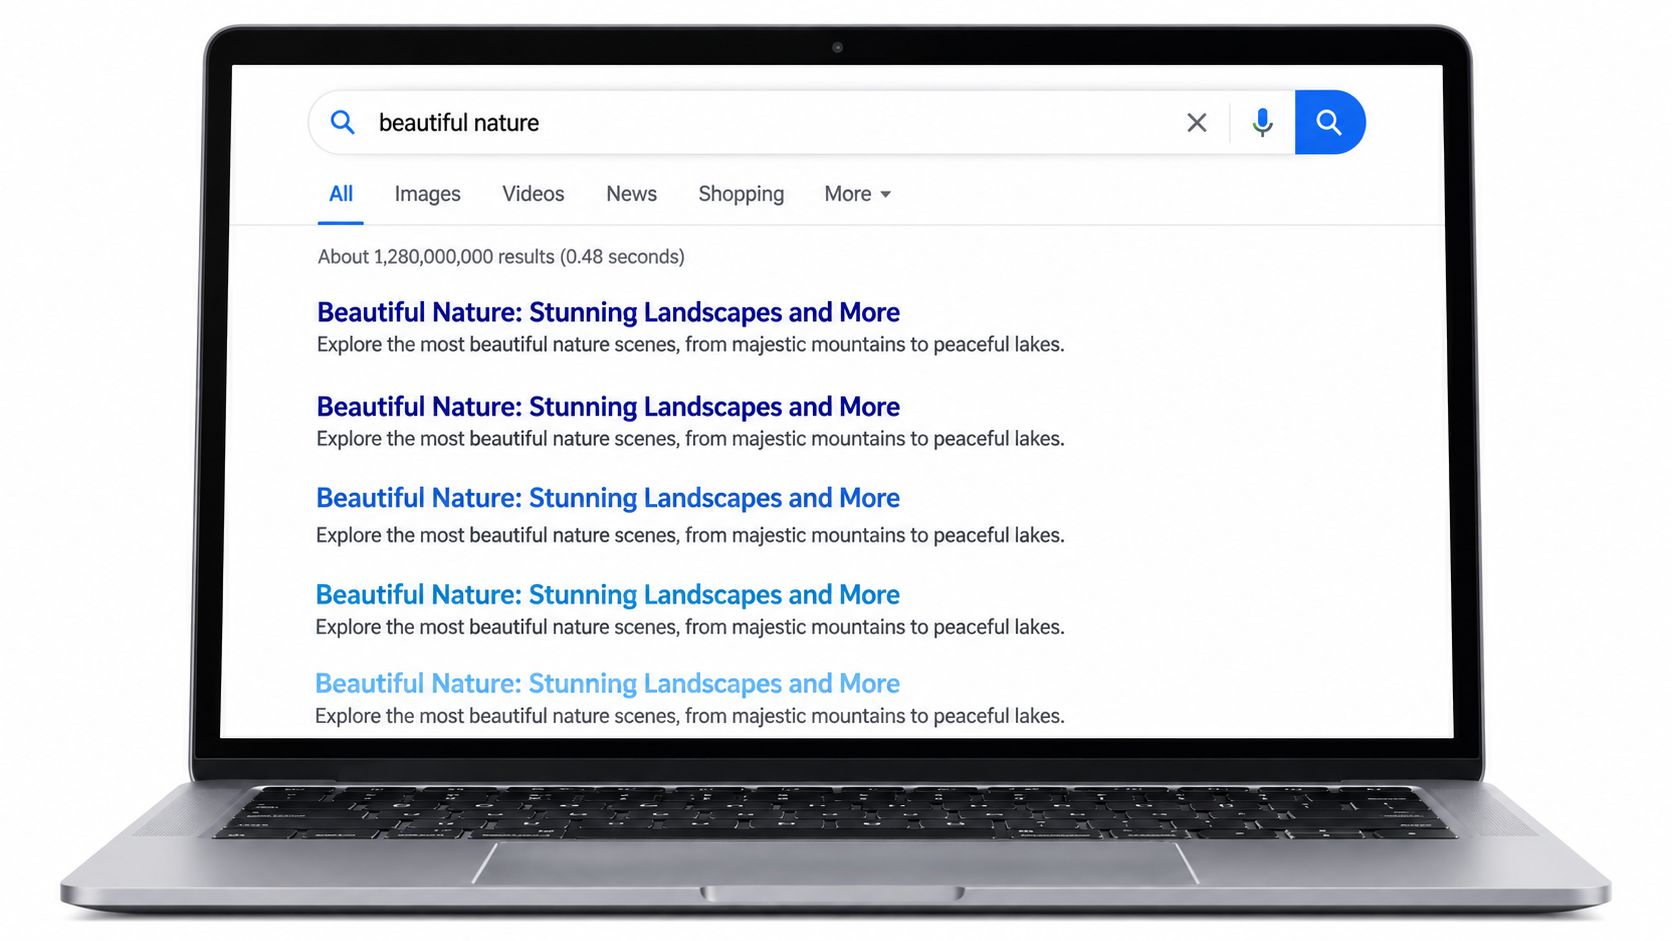
Google once tested many slightly different shades of blue for links and ad-related text across search results and Gmail. Each shade went to a share of users, and the team measured click-through rate. The shade that earned the most clicks won, not the shade anyone preferred in a design review.
As an analyst, I read this example as a warning as much as a success story. Google could afford this test because its traffic volume is enormous and the element appears constantly. Many teams cannot, and shouldn't try.
The Statistical Trap in Multi-Arm Tests
Every extra variant raises the chance that one wins by luck. Add repeated dashboard checks and the risk grows again, since guidance on the peeking problem in A/B testing notes that repeatedly inspecting a conventional p-value can inflate false-positive risk unless you use sequential methods built for interim looks.
- Limit your variants: Fewer arms mean cleaner attribution and faster decisions.
- Correct for multiple comparisons: If you must run many arms, adjust how you judge significance.
- Size the test first: Estimate required sample and your minimum detectable effect before launch, not after an early spike.
Test headlines, offers, and value propositions before micro-styling. A shade of blue only matters when you've already solved message clarity and you have the volume to detect a tiny effect.
3. Bing Ad Headline Extension Test
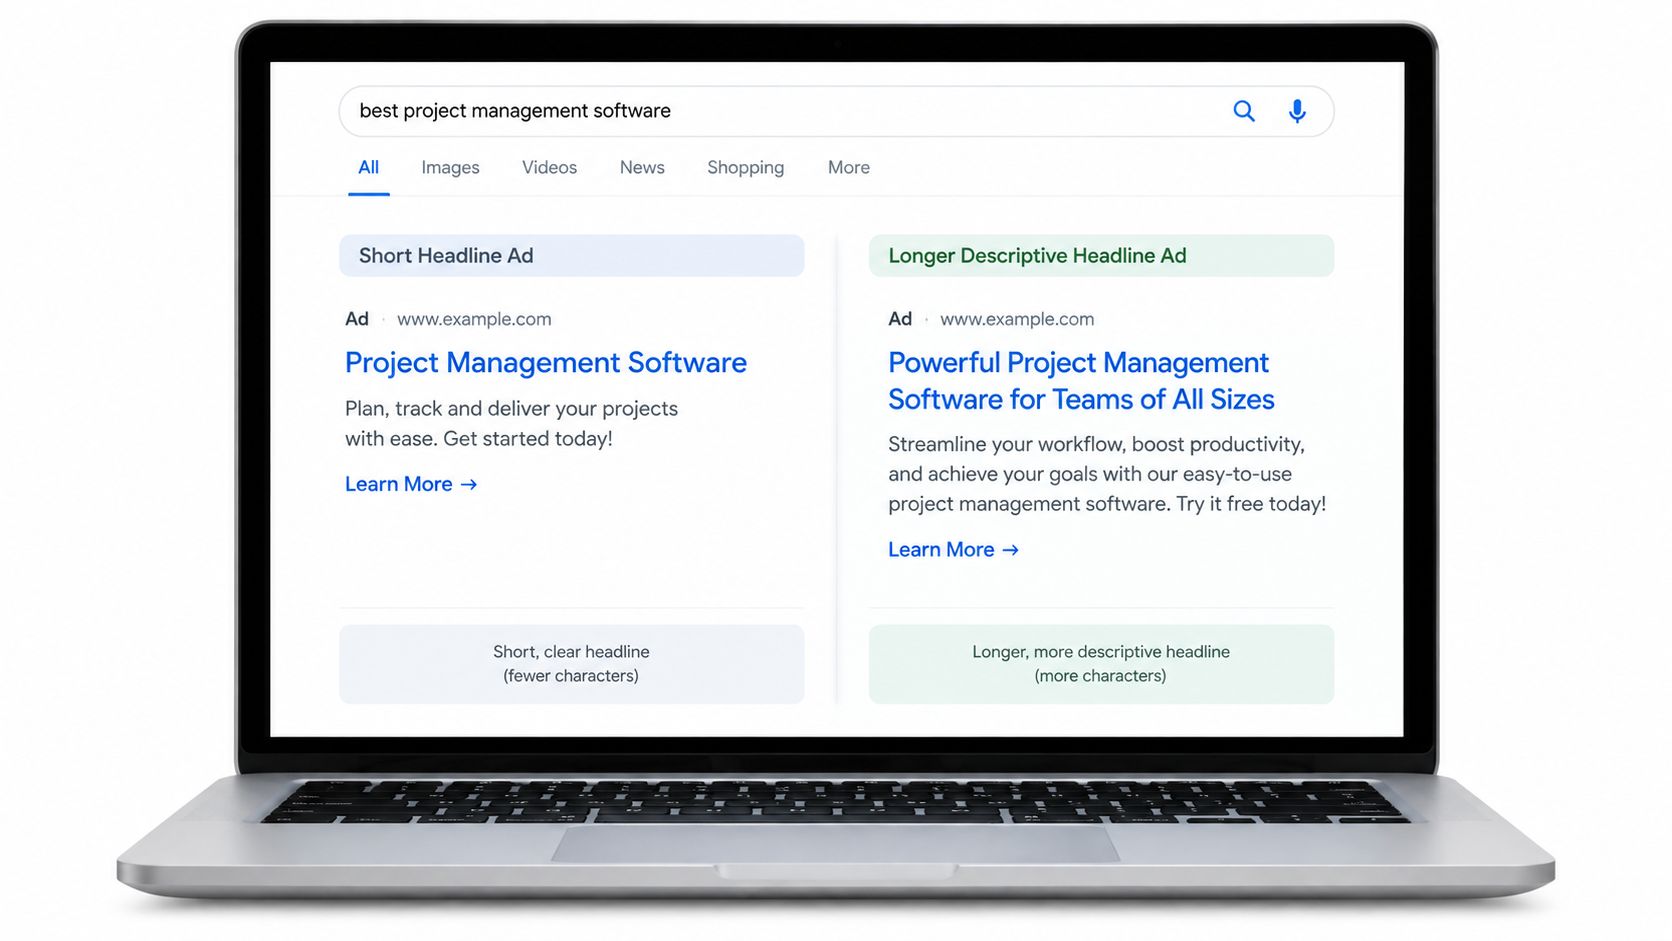
In 2012, a Bing employee tested alternative ways of displaying advertising headlines in search results, adding extra descriptive text to make ads more informative. Real users saw the control or the variant, and Bing measured revenue alongside user-experience indicators. The variant produced a 12% increase in revenue with no measurable negative impact on user-experience metrics, and reports have valued the U.S. annualized impact at more than $100 million.
Nothing about the offer changed. Bing didn't buy more traffic or raise prices. It presented existing content differently, and the baseline scale turned a modest percentage gain into serious money.
Why the Guardrails Matter Here
Revenue alone could've justified a change that annoyed searchers. Bing checked experience metrics at the same time, which is what makes the result trustworthy enough to ship.
- Pair revenue with guardrails: Watch bounce rate, complaints, engagement, and page speed next to your primary metric.
- Test information against brevity: Longer, clearer headlines can beat short ones when they answer a real question.
- Document the learning: A written record turns one win into a pattern your team can reuse.
If you're planning your own version, this guide to running a landing page split test covers the setup. Start with your highest-volume headline, since scale is what turns a small lift into a material result.
4. HubSpot Red vs. Green Call-to-Action Button Test
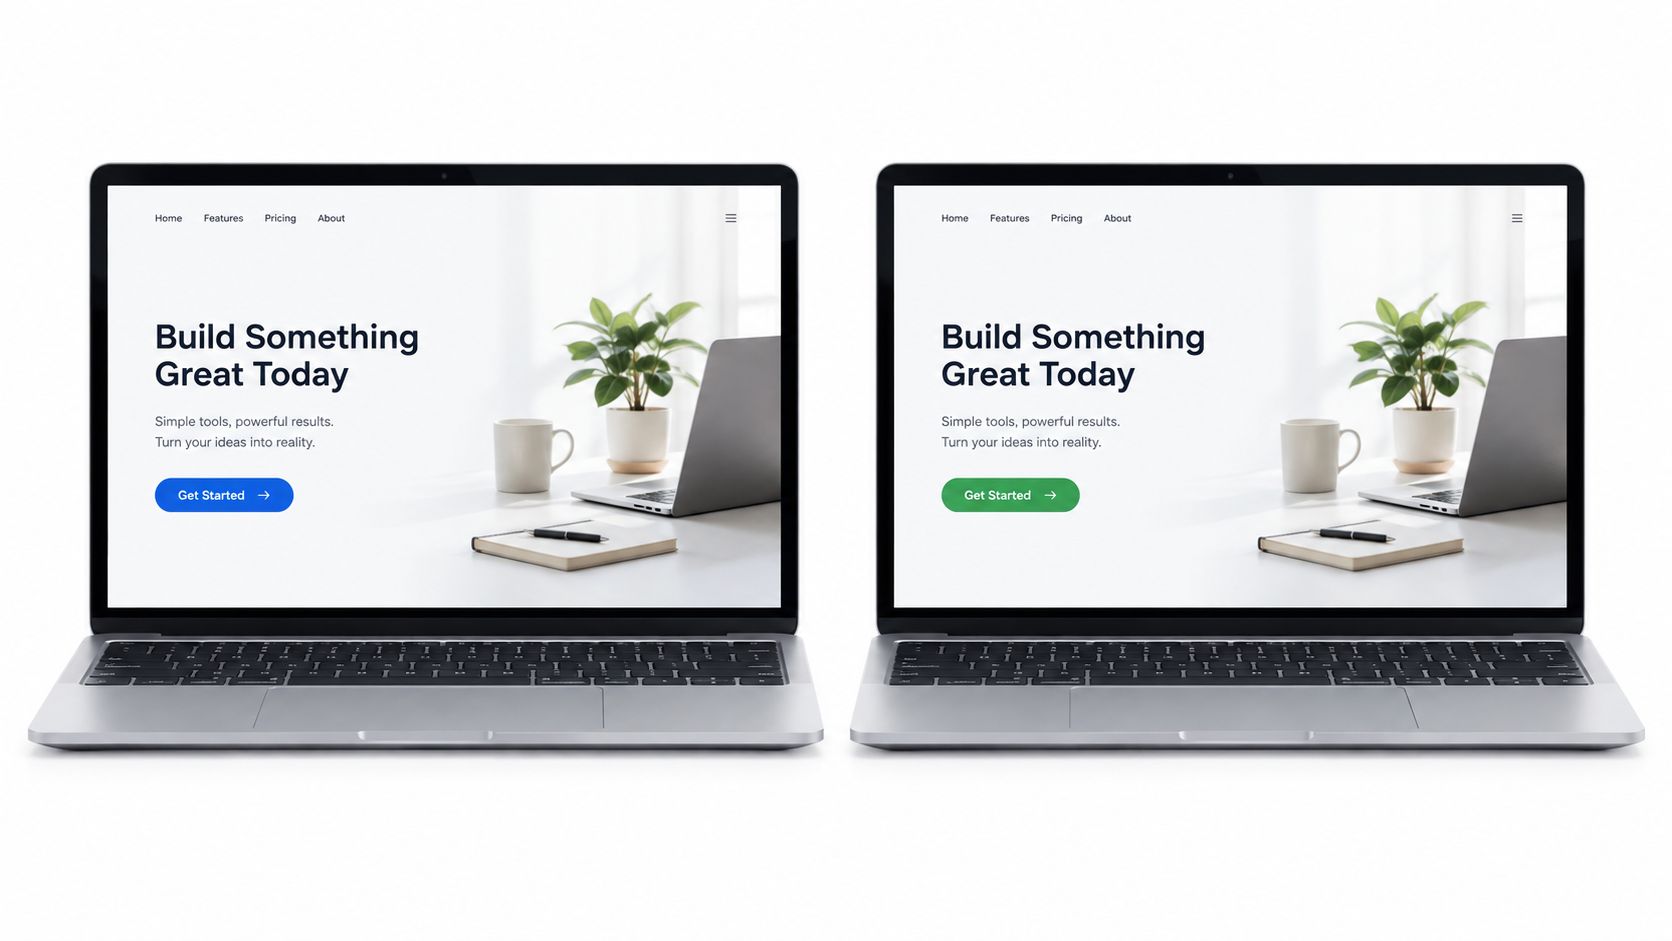
HubSpot tested a red CTA button against a green CTA button on its landing pages, and the red version performed better. The result spread quickly because it contradicted the common belief that green universally signals go. Marketers copied red buttons everywhere, which missed the point entirely.
Color doesn't carry a fixed meaning on a page. What drives the click is contrast against everything around the button. A red button on a page dominated by other colors stands out. Put that same red on a warm-toned page and it can disappear.
How to Run a Button Test That Teaches You Something
Later replications of color tests keep pointing back to contrast, size, and placement rather than hue. That's a useful hierarchy for your own backlog.
- Test in context: Judge the button inside your real page palette, never as an isolated swatch.
- Fix hierarchy first: Size, spacing, and contrast usually move more than a hue swap.
- Know when to move on: Once color results plateau, shift budget to message and offer tests.
A button color win is a local fact about one page, not a law of human psychology.
For a deeper framework on what to test after color, see this breakdown of CTA optimization priorities. Copy the method behind this example, test against your own baseline, and ignore any best-practice list that names a universal winning color.
5. Netflix Personalized Artwork Test
Netflix shows different thumbnails and key artwork for the same title depending on a viewer's taste profile. Someone who watches romance may see the romantic lead. An action fan sees an action still from the identical film. Netflix tests these artwork variants against engagement outcomes such as play rate and watch time.
Classic A/B testing examples start to break down here. There may be no single best thumbnail, because the best presentation depends on who's looking. The average winner can be the wrong answer for large parts of your audience.
The video below walks through how this kind of artwork personalization works in practice.
The Analysis Most Example Lists Skip
Recent work on heterogeneous treatment effects in experiments highlights that differing incentives and user characteristics can bias effect estimates and inflate variance when exposure isn't behaviorally neutral. In plain terms, an average lift can hide opposite effects across segments.
- Predefine a few segments: Pick source, device, or viewing history before launch, and report each with its own uncertainty.
- Keep a non-personalized control: Without a holdout, you can't measure what personalization itself adds.
- Guard against misleading presentation: Artwork that wins clicks but misrepresents content will cost you satisfaction and retention.
Start with one clear signal, such as traffic source. Add complexity only when the simpler version proves it can beat a clean control.
6. Booking.com Scarcity and Urgency Messages
Booking.com tests messages like only a few rooms left and notes about other people viewing the same property. The company has described a culture of running many experiments, expecting most to fail, and measuring whether urgency produces real bookings rather than extra clicks. Urgency is treated as a hypothesis, not a default tactic.
That framing matters, because scarcity copy is easy to abuse. A message that lifts bookings this week can raise complaints, cancellations, and distrust later if visitors feel pressured or misled.
Measure Past the Booking Click
A useful comparison comes from an ecommerce mini-cart redesign where overall conversion rose from 1.83% to 1.96% while total purchased quantity doubled over 36 days. The rate moved modestly, but the commercial outcome moved a lot. Judging that test on clicks alone would've understated its value, and the same logic applies in reverse for urgency.
- Show only true scarcity: Log the inventory data behind every message so you can defend it.
- Test against a neutral control: Measure bookings plus refund and complaint rates as guardrails.
- Segment by visitor type: New and returning visitors often react very differently to pressure.
Decision test: If an urgency message wins on conversion but loses on refunds or complaints, it hasn't won.
Ship scarcity only when it survives both the primary metric and the trust metrics. That's what separates an experiment from a dark pattern.
7. Ad-to-Landing-Page Message Match (Dynamic Keyword Insertion)
Message match testing compares a generic landing page headline with one that mirrors the keyword, ad copy, or offer that brought the visitor. Google Ads offers Dynamic Keyword Insertion for ad text, and landing page tools offer dynamic text replacement for on-page headlines. A searcher looking for accounting software for freelancers sees that exact promise instead of a broad product claim.
The hypothesis is simple. When the page confirms the visitor's intent in the first seconds, fewer people bounce and more people convert. Published lift figures for this pattern vary widely by industry, so treat any specific claim you find elsewhere with caution and test it on your own traffic.
Where Message Match Tests Go Wrong
Dynamic headlines fail when campaigns are messy. One ad group covering ten intents can't map to one sharp headline, and raw keyword insertion can produce awkward or misleading copy. Come Together Media's DKI guide covers the mechanics of insertion in ad text, which pairs naturally with matching on-page copy.
- Set a fallback headline: Unknown, long, or misspelled keywords need a safe default.
- Keep ad groups tight: Each landing variant should map to one clear intent.
- Measure by source: Confirm the effect holds for paid and organic traffic separately before you roll out.
This is the closest classic pattern to source-level personalization. You're no longer asking which headline wins overall. You're asking which headline wins for each arrival context.
8. New Versus Returning Visitor Messaging Test
This test compares one generic landing page against a variant that changes messaging by visit history. A first-time visitor sees a headline explaining the value proposition. A returning visitor sees copy that speaks to a decision already in progress, such as a clearer offer, a saved-cart reminder, or recently viewed items.
The logic is sound. New visitors need context before they can evaluate you. Returning visitors have context, so repeating the full introduction wastes their attention and your most valuable seconds.
Read the Segments, Not Just the Average
This is the heterogeneous effects problem in everyday form. A variant can help returning visitors, hurt new ones, and look flat in aggregate. If you only read the blended number, you'll kill a change that works or ship one that harms your largest segment.
- Analyze segments separately: Report new and returning results side by side, with enough traffic in each.
- Keep the value proposition stable: Returning visitors should recognize the same product, presented more directly.
- Run a holdout: A generic-page control tells you whether personalization beats doing nothing.
For more patterns like this, these website personalization examples show how segment-specific messaging gets structured in practice. Decide in advance what evidence would justify two experiences instead of one. Weak segment data is a reason to keep testing, not a reason to personalize.
A/B Testing Examples: Side-by-Side Comparison
Use the table as a decision aid rather than a leaderboard. The reported outcomes came from specific contexts, so the transferable information sits in the complexity, traffic, and use-case columns more than in any single lift figure.
| Example | 🔄 Implementation Complexity | ⚡ Resource Requirements | 📊 Expected Outcome / Metric | 💡 Ideal Use Case & Key Advantage |
|---|---|---|---|---|
| Obama 2008 Sign-Up Button and Media Test | High: multivariate CTA and media combinations | High traffic; sufficient sample per combination | Reported a substantial lift in email sign-ups; donation impact was estimated | Landing pages where creative elements may interact; tests combinations rather than elements alone |
| Google's 41 Shades of Blue | Medium: many variants of one element | Very high traffic; careful multiple-comparison controls | Higher link click-through rate; revenue impact is reported but approximate | High-volume products testing small interface changes; isolates the effect of color |
| Bing Ad Headline Extension | Low: copy-only A/B test with guardrails | Very high search traffic; monitoring of user-experience metrics | Reported ~12% increase in revenue per search without degrading user-experience guardrails | Search ads where additional wording may clarify value; links copy tests to business outcomes |
| HubSpot Red vs. Green CTA | Low: single-element color test | Standard landing-page traffic and A/B testing tools | Reported a clear lift in clicks for the red CTA variant | Teams testing CTA visibility; highlights contrast and page context over universal color rules |
| Netflix Personalized Artwork | High: audience-based personalization and continuous testing | Large behavioral datasets, content tagging, and experimentation infrastructure | Changes in play rate and watch time by viewer segment | Large content catalogs; adapts presentation to viewer interests |
| Booking.com Scarcity and Urgency Messages | Medium to high: contextual messages tied to live signals | Accurate inventory or activity data; high traffic for testing | Booking conversion; monitor complaints and refunds as guardrails | Booking flows with genuine scarcity or social proof; tests urgency when relevant |
| Ad-to-Landing-Page Message Match | Medium: dynamic headlines and campaign mapping | Organized campaigns, tracking, and fallback copy | Conversion rate and bounce rate by traffic source | Paid-search landing pages; aligns page content with visitor intent |
| New vs. Returning Visitor Messaging | Medium: visitor recognition and segmented variants | First-party identifiers and adequate segment sizes | Conversion rate by new and returning visitor segment | E-commerce or SaaS journeys with distinct visitor stages; tailors messaging to familiarity |
Two patterns stand out: the cheapest tests to build demanded the most traffic to read, and the personalization rows trade statistical difficulty for infrastructure.
Turn These Examples Into Your Next Winning Test
The transferable lesson across these A/B testing examples isn't a headline, a button color, or an urgency claim. It's a sequence. Start with a measurable business hypothesis, choose one meaningful variable, define a control and a primary metric, add guardrails for trust and experience, and confirm your traffic can support a reliable result before you launch.
Copy length shows how clean that sequence can be. In one commercial experiment with 535 visitors where content volume was the only changed factor, the short page converted at 53.44% against 38.83% for the long page. The lesson isn't that short always wins. It's that isolating one variable, holding the offer, form, and layout constant, lets you attribute the effect to the thing you changed.
Decide What Would Make You Act
Most example libraries never answer the executive question. When is evidence strong enough to ship, and when should you do nothing? Define your stopping rule and the minimum lift worth paying for before launch. A tiny gain can be statistically credible and still not cover implementation, maintenance, or discount costs. An early spike that fades with more data is a normal outcome, not a near miss. Treat a valid no-difference result as a real answer that frees budget for a braver test.
Segment thinking belongs in that decision too. Predefine a small number of segments, check whether the effect holds across source, device, and visit history, and keep a holdout control after rollout when you personalize. That discipline is what separates a testing program from a collection of anecdotes. If the wider discipline is new to your team, this explainer on what is CRO and why it matters is a solid starting point.
For teams ready to move past one-off tests, Polish applies the same principle continuously. It reads your page, generates alternative headlines, subheadings, and CTAs, and serves the version best suited to each visitor's source, campaign, device, country, and visit history. That's the Netflix and message-match logic, run as an ongoing experiment instead of a quarterly project.
Pick one page with real traffic and one bottleneck you can name. Write the hypothesis, the primary metric, and the guardrails in a single paragraph. If you can't write that paragraph, you don't have a test yet. You have a design opinion, and design opinions are what these eight examples exist to replace.
Polish writes a landing page for every visitor, testing headline, subheading, and CTA variants against real conversions and matching each version to the source, campaign, device, and visit history behind the click. If you want that experimentation running continuously instead of one manual test at a time, visit Polish and put your highest-traffic page to work.
- a/b testing examples
- a/b testing
- conversion optimization
- split testing
- experimentation
Your website rewrites itself until it converts.
Polish writes new versions of your headlines and CTAs, tests them on your real visitors and keeps the ones that win.
Start free