What Is Conversion Rate Optimization and Why It Matters
Learn what is conversion rate optimization, why it matters for growth teams, the metrics that define it, and the methods that actually move the needle.
Published on 13 min read

Table of contents
- A Landing Page That Gets Traffic but No Signups
- Replace opinion with a testable question
- Defining Conversion Rate Optimization in Plain Language
- Choose the action before changing the page
- Why CRO Matters for Growth and Revenue
- The Key Metrics Every CRO Program Tracks
- Build a focused measurement view
- Protect the business outcome
- How Analytics and Experimentation Work Together
- Move from observation to hypothesis
- Real Examples of CRO Changes That Move the Needle
- Example one, replace a generic promise
- Example two, remove uncertainty at checkout
- Example three, reduce form friction
- Common CRO Misconceptions That Hold Teams Back
- Myth one, the site needs a redesign
- Myth two, personalization fixes conversion
- Myth three, more traffic solves the problem
- Myth four, CRO means button color and copy
- Getting Started With CRO This Week
- Day one, define the outcome
- Day two, verify the instrumentation
- Day three, observe the page
- Day four, write the hypothesis
- Day five, prepare the experiment
Conversion rate optimization is the systematic process of raising the share of visitors who complete a desired action, measured as conversions divided by total visitors multiplied by 100. Current benchmark sources place average website conversion rates around 2.5% to 3.5%, while top-performing websites can reach 11% or higher.Conversion optimization statistics for 2026
Your acquisition dashboard looks healthy. Paid campaigns are live, organic traffic is growing, and the pricing page has plenty of visits. Yet signups barely move. The difficult question isn't whether the page needs “more impact.” It's identifying the exact point where interested visitors hesitate, lose confidence, or can't complete the next step.
That distinction defines CRO. It isn't a synonym for redesign, persuasive copy, or better-looking buttons. CRO is a measurement discipline that uses research, hypotheses, controlled experiments, and business metrics to improve a defined action. An AI landing-page workflow can accelerate the work, but it still needs a reliable baseline, a clear test design, and a decision rule.
A Landing Page That Gets Traffic but No Signups
A growth team has spent weeks on paid ads, SEO updates, and partnership campaigns. Around 8,000 monthly visitors reach its pricing page, but only 40 people sign up. The dashboard shows high cost per click and strong time on page. The signup chart remains flat.
The team starts arguing. The designer sees a dated layout. The copywriter thinks the headline doesn't explain the product. Sales says the offer isn't strong enough. The performance marketer wants more traffic because the acquisition campaigns are already producing visits. Everyone has a plausible explanation, but nobody has isolated the problem.
landing page optimization becomes a CRO problem rather than a styling exercise. The team needs to define the conversion event, verify the tracking, segment performance, inspect user behavior, and identify the most likely friction. A heatmap might reveal that visitors aren't reaching the form. Session recordings might show repeated attempts to understand pricing. Analytics might show that mobile visitors abandon the page after selecting a plan.
Replace opinion with a testable question
Instead of saying, “The page needs a redesign,” the team can write a hypothesis:
If we make the plan differences easier to compare, more qualified visitors will start a signup because uncertainty is blocking the next step.
That statement gives the team something concrete to change and measure. The control remains available, the variant has a defined purpose, and the primary metric is signup conversion rate. A guardrail metric, such as average order value or page-load performance, can reveal whether the change creates a hidden cost.
The result might confirm the hypothesis, reject it, or show that the effect applies only to a particular audience segment. All three outcomes are useful. CRO turns a frustrating dashboard into a learning system, then uses that learning to improve the page, the campaign message, and eventually the offer itself.
Defining Conversion Rate Optimization in Plain Language
Start with one equation:
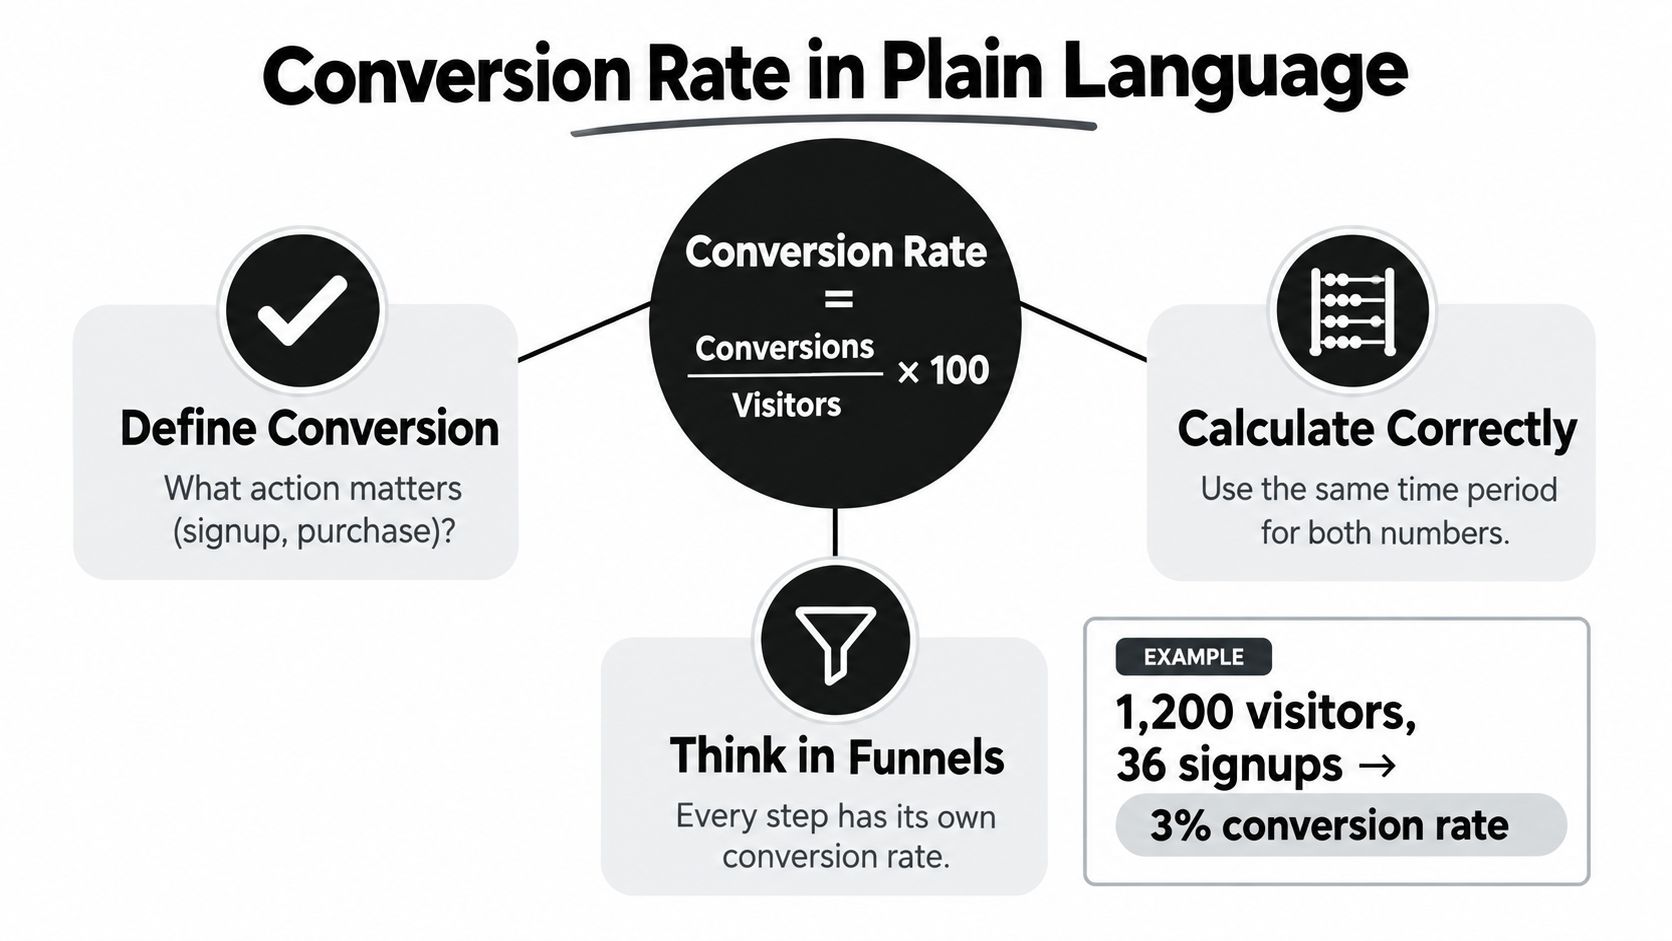
Conversion rate = (conversions ÷ total visitors) × 100
If 1,200 visitors reach a landing page and 36 sign up, the calculation is (36 ÷ 1,200) × 100, which produces a 3% conversion rate. If the same page generated 5%, it would produce 60 signups from that visitor count. The arithmetic is simple. The management challenge is defining which visitors, conversions, and time period belong in the calculation.
Choose the action before changing the page
A conversion can be a purchase, signup, demo request, quote request, or completed form. The primary action is often called a macro-conversion because it represents the main business outcome. Smaller actions, such as clicking a CTA, viewing pricing, watching a product video, or reaching a meaningful scroll point, are micro-conversions. They help explain movement through the funnel, but they shouldn't replace the business goal without a clear reason.
CRO is different from the disciplines that contribute to it:
- SEO helps qualified people discover a page.
- UX design makes the experience easier to understand and use.
- Copywriting clarifies value, objections, and next steps.
- CRO establishes the measurement loop that tests whether those changes improve the chosen action.
The loop is repeatable: research behavior, define a problem, write a hypothesis, create a variant, run a controlled test, evaluate the primary and guardrail metrics, and record the learning. The same method works for a landing page, checkout, pricing flow, or lead form.
A useful AI workflow follows that sequence. The system can inspect page content, generate alternative headlines or CTAs, and place variants in front of real visitors. It shouldn't decide that a rewrite “worked” because the copy sounds stronger. The winning decision still depends on clean measurement and a test that separates signal from random variation.
Why CRO Matters for Growth and Revenue
A page can get traffic and still leave revenue on the table. That gap is why CRO matters. It helps teams measure where interested visitors drop out, then test changes that improve the outcome instead of guessing which rewrite or layout might work.
The economic case starts with the spread between ordinary and strong performance. One 2026 roundup places average website conversion rates between 2.5% and 3.5%, while another source reports a global average of 3.68% and says top-performing websites can reach 11% or higher.2026 conversion optimization statistics These are reference points, not universal targets, because conversion depends on traffic quality, device mix, industry, offer, and funnel stage.
A landing-page benchmark based on 41,000 landing pages, 464 million pageviews, and 57 million conversions reported a median conversion rate of 6.6% across industries.Unbounce Conversion Benchmark Report That gap between broad website averages and landing-page medians matters. It shows why teams should compare similar page types, then measure progress against their own baseline.
Acquisition campaigns pour visitors into the funnel. CRO fixes the leaks that let interested visitors leave before converting. More traffic can raise volume, but it does not repair a confusing offer, a broken form, or a checkout that creates doubt.
| Segment | Conversion Rate | Monthly Conversions at 10K visitors | Implied Uplift |
|---|---|---|---|
| Average website range | 2.5% to 3.5% | 250 to 350 | Baseline range |
| Global average website | 3.68% | 368 | Reference point |
| Top-performing website | 11% or higher | 1,100 or more | Material upside |
The table shows the size of the opportunity without implying that every business can jump straight from average to top performance. A growth leader should first check whether the baseline blends paid and organic traffic, mobile and desktop visits, new and returning users, and branded and non-branded demand. One blended rate can hide a strong segment and a weak one.
CRO also creates knowledge that acquisition reporting cannot give on its own. Tests show which promise gets attention, which objection stops action, which audience needs more proof, and where the value proposition does not match what visitors expected. That learning can improve ads, sales enablement, onboarding, and product messaging. It also gives teams a practical workflow for a guide to landing page optimization, especially when AI is used to propose variants, not to declare a winner without evidence.
The Key Metrics Every CRO Program Tracks
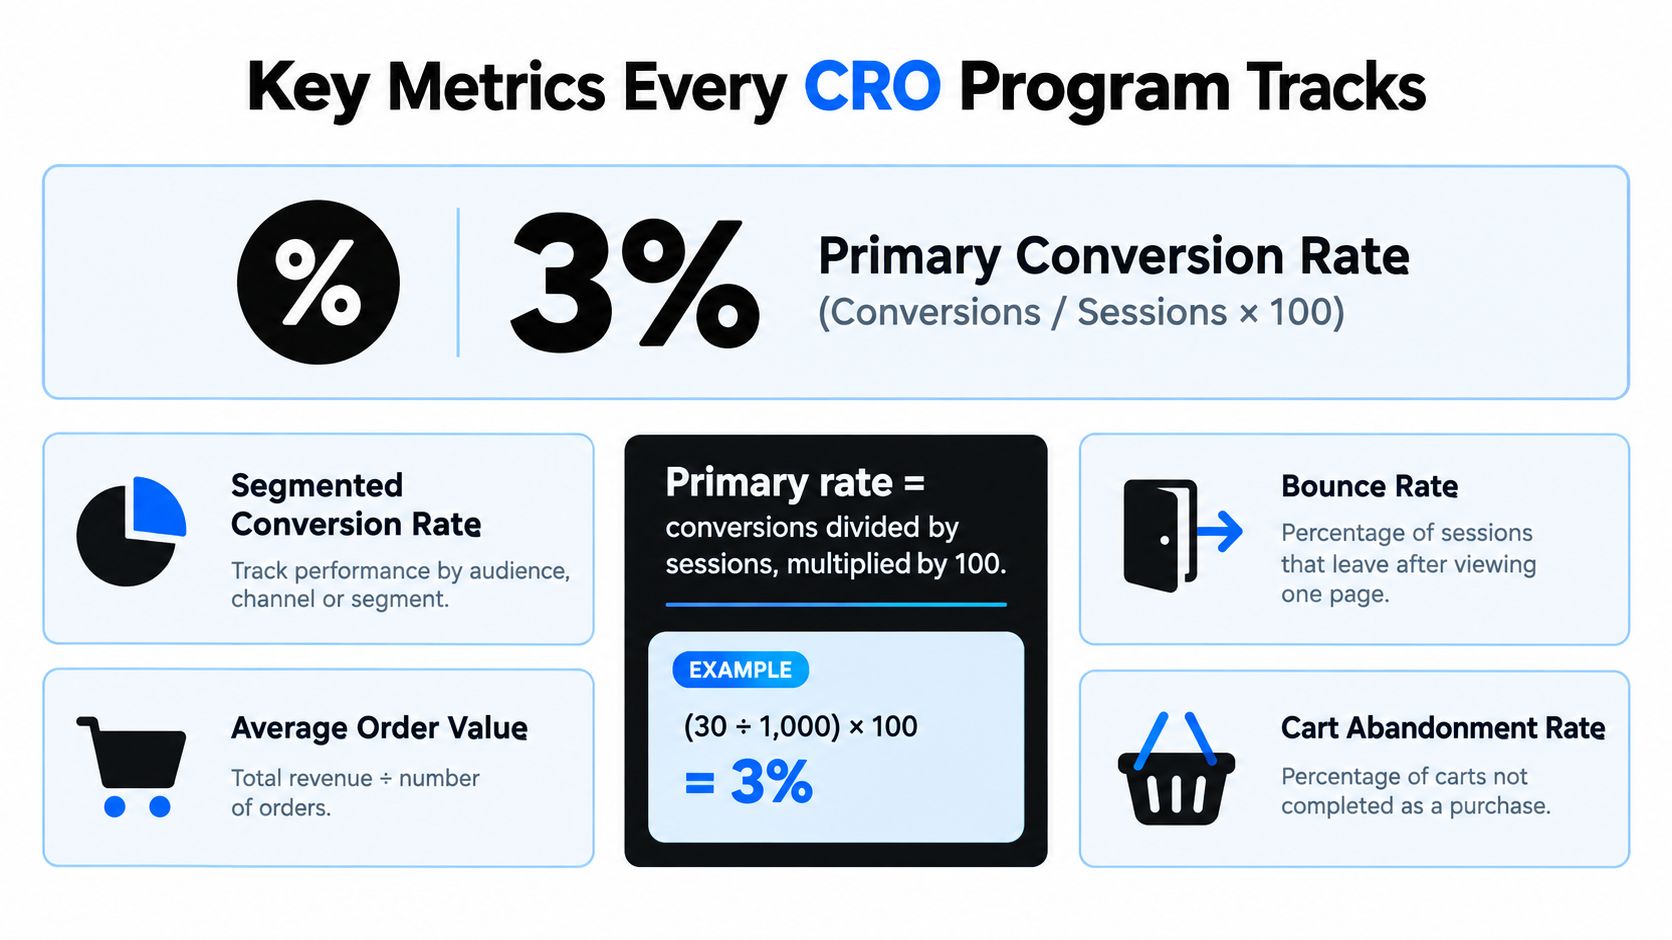
A serious CRO program starts with one primary conversion rate, then adds the context needed to interpret it. Use the defined formula, keep the visitor or session rule consistent, and compare equivalent periods. The number matters only when the team knows what it includes.
Build a focused measurement view
Segment the primary rate by traffic source, device, landing page, audience, and funnel stage. A mobile page can look acceptable in aggregate while failing for paid visitors. A pricing page can appear weak overall while converting efficiently for high-intent organic traffic. Segmentation identifies where a test should run and prevents a broad average from directing the wrong work.
Micro-conversions provide diagnostic clues:
- CTA clicks show whether the page creates enough immediate interest to start the next step.
- Scroll depth indicates whether visitors reach proof, pricing, or the form.
- Form starts reveal intent before completion.
- Add-to-cart events separate product-page interest from checkout friction.
Teams can use funnel analysis to find your biggest funnel leaks before choosing a page change. The aim isn't to track every interaction. Choose the micro-events that explain the path from arrival to the primary conversion.
Protect the business outcome
For commerce and revenue teams, conversion rate alone can mislead. Revenue per visitor and average order value show whether a variant creates valuable customers or merely more low-value actions. A test can increase signups while lowering lead quality, or increase purchases while reducing order value. Those are not automatic wins.
Statistical significance, confidence intervals, and minimum detectable effect help teams judge whether an observed difference is likely to be meaningful rather than random noise. Sample size should reflect baseline conversion rate and the smallest improvement worth detecting. A practical conversion lift calculator can help frame the expected change before an experiment begins.
Give each page one North Star metric, supported by a small set of diagnostic and guardrail metrics. A focused dashboard makes decisions easier than a wall of charts.
How Analytics and Experimentation Work Together
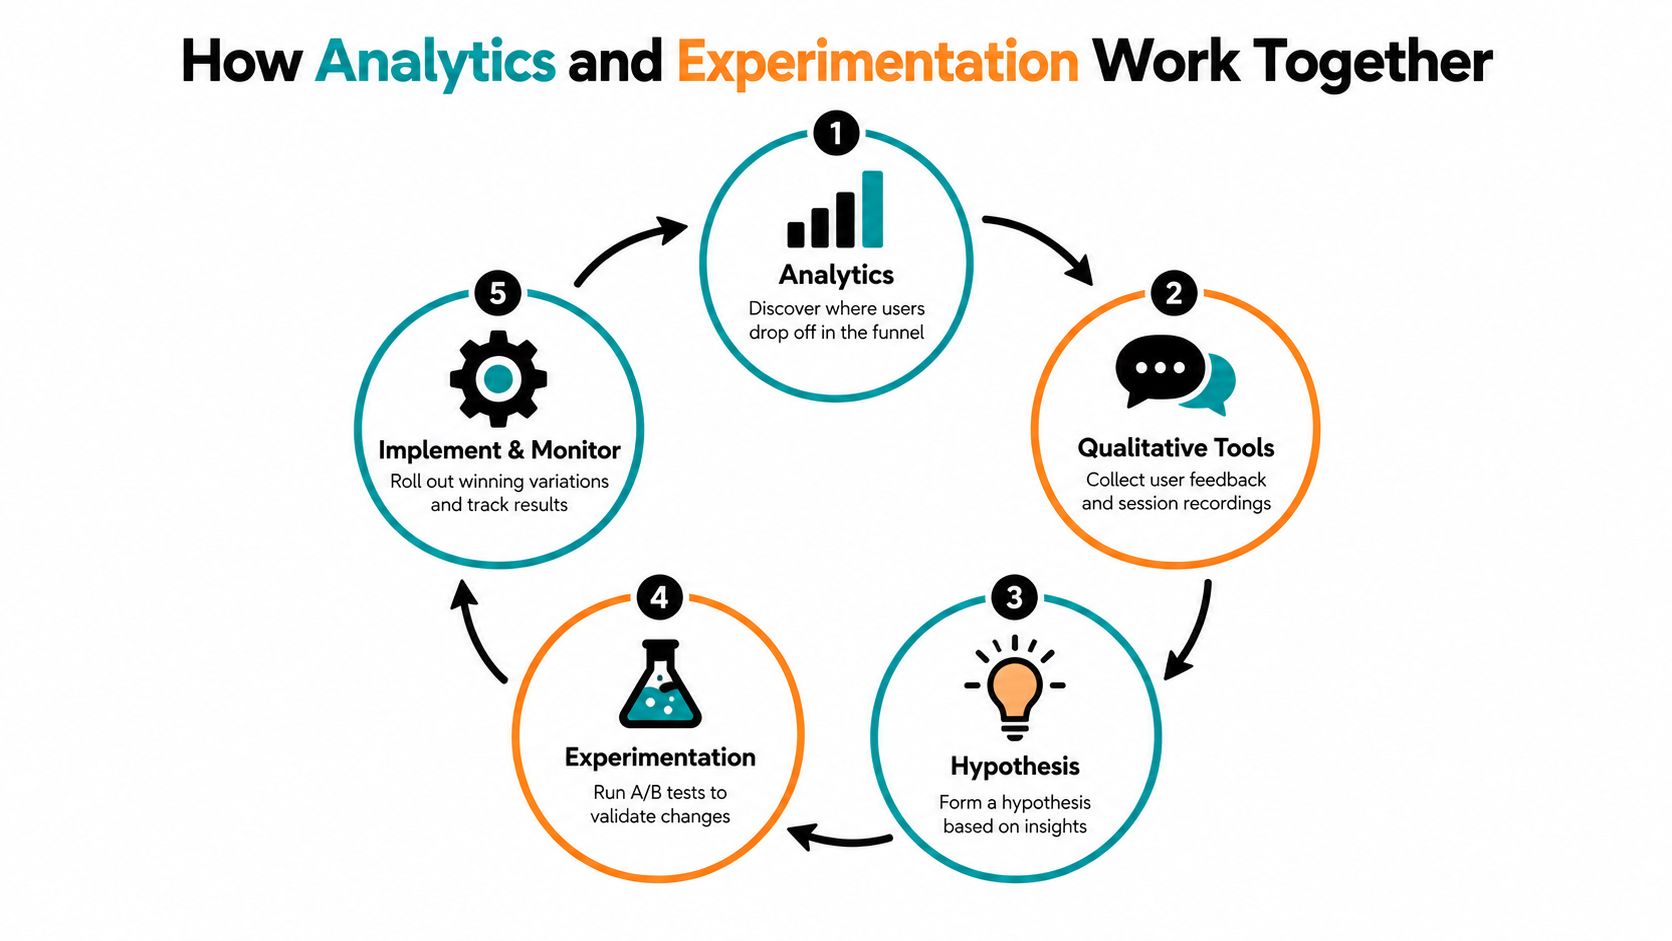
A landing page can attract traffic and still miss signups. Analytics shows where the drop happens, experimentation checks whether a change fixes it. That is why CRO works better as a measurement system than as a design opinion contest.
Move from observation to hypothesis
The practical loop is simple. First, analytics identifies the leak, whether that is the landing page, CTA, form, checkout, or confirmation step. Heatmaps then show attention patterns, such as ignored buttons, stray clicks, or sections that get almost no interaction.
Session recordings add behavior. They reveal hesitation, repeated clicks, backtracking, and form errors that are hard to spot in a dashboard. Surveys add language. They tell you what visitors expected, what confused them, or what stopped them from moving ahead.
From there, a hypothesis turns the observation into a test. State the change, the audience, the expected direction, and the primary metric. That structure matters because AI-driven landing-page workflows can generate many page variants, but only a disciplined hypothesis tells you which one deserves a test.
The first four steps generate ideas. They do not prove the idea will improve conversion. a practical guide to A/B/n testing is useful here, because A/B testing is the validation layer. It compares a control with a variant under the same conditions, so the team can separate a real effect from random fluctuation.
For a clear explanation of what statistical significance means, see this guide from Arlo Inc. before interpreting your experiment results. Statistical significance does not tell you whether a change matters strategically. It only shows that the observed difference passed a defined test for random variation. You still need to weigh effect size, quality, revenue, and implementation cost.
Watch this overview of the experimentation cycle before designing your next test:
An AI landing-page builder fits into the implementation layer. It can map page content, generate alternative messaging, and deploy variants without waiting for a full engineering sprint. The workflow stays disciplined when the AI output enters a controlled experiment, follows a clear hypothesis, and remains under monitoring.
Real Examples of CRO Changes That Move the Needle
A CRO example is useful only when it includes the reasoning behind the change. The following scenarios illustrate how a team can move from an observed problem to a test, without treating the outcome as guaranteed.
Example one, replace a generic promise
A SaaS page opens with “Welcome to Our Platform.” Visitors understand that a product exists, but they don't learn what it helps them accomplish. The hypothesis is that an outcome-led headline will create stronger message match for growth teams.
The variant says, “Ship Landing Pages Faster.” The team keeps the rest of the page unchanged and measures completed signups, while checking lead quality as a guardrail. If the variant wins, the learning isn't merely that one headline is better. It suggests that visitors respond more clearly to an operational outcome than to a category description, which can inform ad copy and sales messaging.
Example two, remove uncertainty at checkout
An ecommerce checkout contains a muted gray “Submit Order” button. It blends into the surrounding interface and gives the visitor little reassurance about what happens next. The hypothesis is that a clearer, higher-contrast CTA with more explicit wording will make the final action easier to recognize.
The test should track completed purchases, not just button clicks. The team should also watch payment errors, average order value, and customer-support contacts. A click increase without more completed orders would indicate that the new treatment attracts attention but doesn't solve the underlying concern.
Example three, reduce form friction
A lead-generation form asks for nine fields before a visitor can request a conversation. The team suspects that several questions belong later in qualification, not at the first exchange. It tests a four-field version and measures qualified form completions rather than raw submissions alone.
This test can produce several outcomes. More completions with weaker qualification may require a different follow-up process. Fewer completions but better-fit leads may be commercially stronger. The important practice is to name the metric and hypothesis before launch, then use the result to choose the next experiment rather than declaring a page permanently “optimized.”
Common CRO Misconceptions That Hold Teams Back
CRO programs stall when teams mistake a plausible idea for evidence. The most expensive misconceptions usually sound reasonable because they focus on visible changes rather than measurement quality.
Myth one, the site needs a redesign
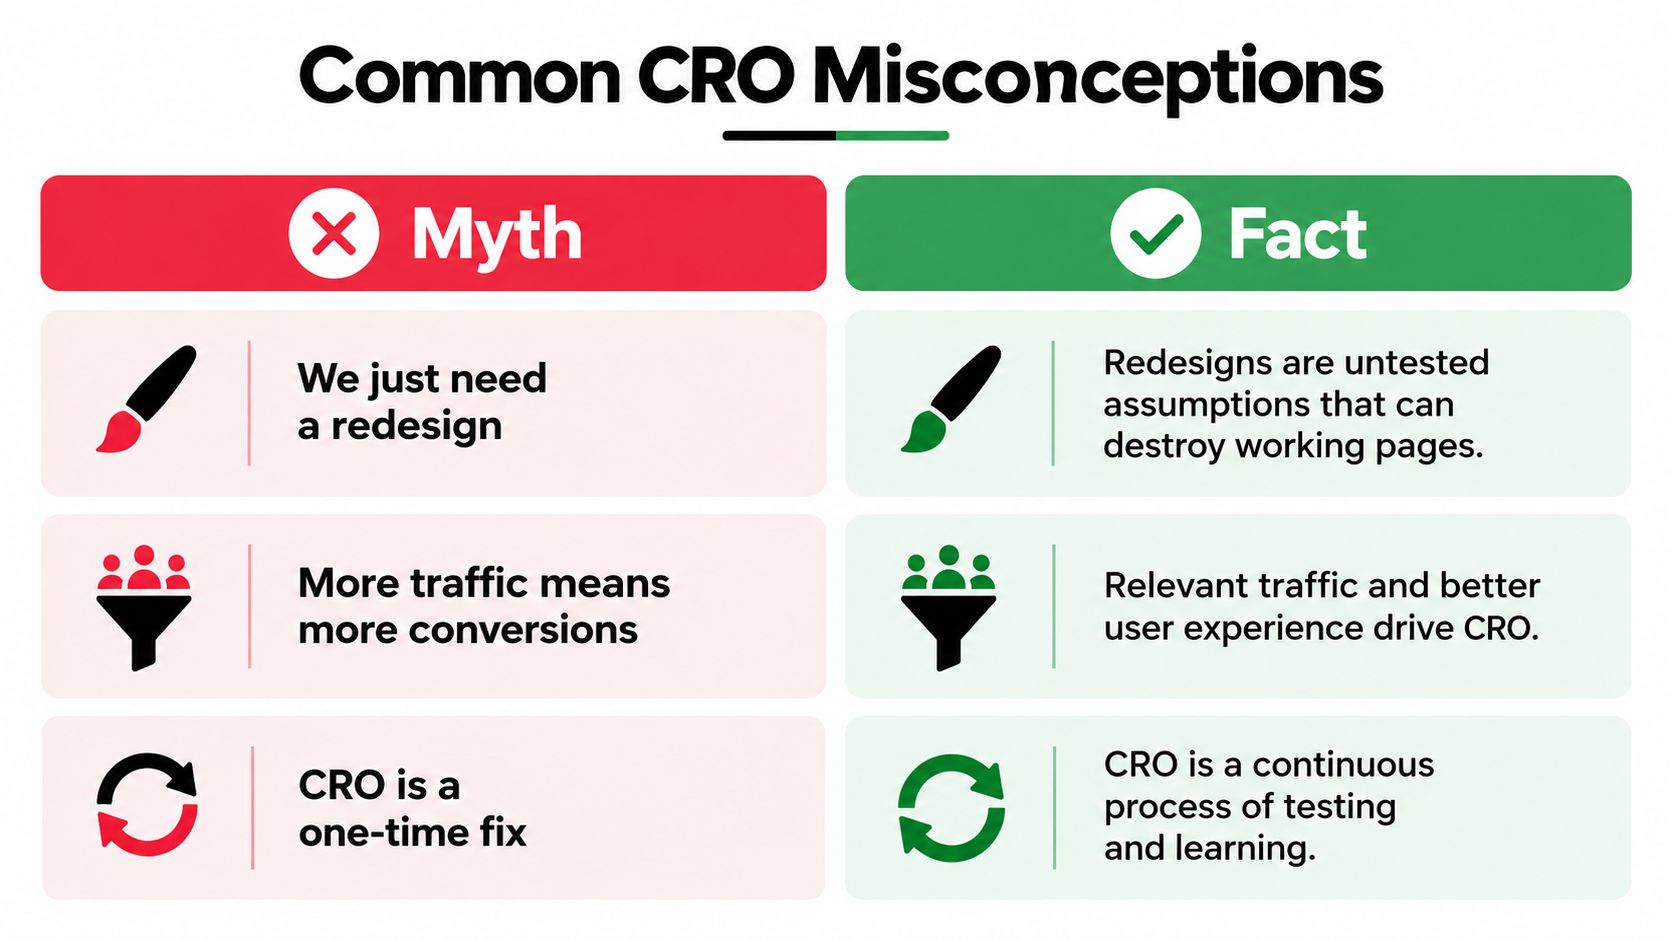
A redesign changes many variables at once. If conversion improves, the team may not know why. If it falls, the team may struggle to identify which existing element was working. A redesign can be appropriate, but without a baseline, control experience, and test plan, it's an assumption rather than optimization.
Myth two, personalization fixes conversion
Personalization can improve message relevance, but it doesn't remove the need for a reliable control. A personalized page can make analysis harder when each audience sees different content and sample sizes become fragmented. First establish a strong baseline, then personalize where the evidence shows a meaningful segment difference.
Myth three, more traffic solves the problem
More traffic creates more opportunities, but it doesn't repair a weak conversion path. If visitors arrive with the wrong expectation, a larger audience can produce more unqualified sessions and more wasted acquisition effort. Improve relevance and friction before increasing volume.
Myth four, CRO means button color and copy
Copy and interface details can matter, but they're only inputs. A credible program also examines the offer, audience intent, device experience, form behavior, technical performance, and downstream value. Without segmentation and controlled testing, a visual tweak produces an anecdote, not a dependable lift.
Better mental model: CRO isn't a hunt for a magic element. It's a system for reducing uncertainty about what helps a specific audience complete a specific action.
Getting Started With CRO This Week
You don't need a large optimization department to establish the operating rhythm. A growth lead can create a usable first experiment in five working days by keeping the scope narrow and documenting every assumption.
Day one, define the outcome
Write down the primary conversion event and the formula, conversions divided by visitors multiplied by 100. Specify the page, audience, attribution window, and time period. Use a relevant benchmark as context, but don't turn a broad industry average into a promise. Your initial target should reflect traffic quality, device mix, and the friction visible in your own data.
Day two, verify the instrumentation
Check that the primary conversion event fires once and only once. Add two useful micro-conversions, such as CTA clicks and meaningful scroll depth. Separate paid, organic, and direct traffic, and confirm that mobile and desktop data aren't being combined in a way that hides a failing experience.
Day three, observe the page
Review recordings and heatmaps for the highest-traffic landing page. Document three specific friction observations, each with the affected audience and page location. Look for repeated hesitation, ignored information, confusing clicks, form errors, and points where visitors leave before reaching the offer.
Day four, write the hypothesis
Turn the strongest observation into a testable statement. Name the proposed change, the audience, the primary metric, and the predicted direction of movement. Avoid bundling a new headline, layout, form, and offer into one test unless the purpose is to compare different page experiences.
Day five, prepare the experiment
Set the control, variant, primary metric, and guardrail metric in your experimentation platform. Calculate whether the available traffic can detect the improvement you care about, and define how you'll handle device, channel, and funnel-stage differences. Queue the test only after tracking has been checked.
CRO compounds through repeated cycles of observation, testing, implementation, and monitoring. Polish offers an AI landing-page workflow that reads a page, writes alternative headlines, subheadings, and CTAs, serves those versions to visitors, measures performance, and keeps the winning version live. If you want to turn this week's hypothesis into a controlled landing-page test, visit Polish and review how it can fit into your experimentation process.
- conversion rate optimization
- CRO basics
- conversion metrics
- landing page CRO
- growth experimentation
Your website rewrites itself until it converts.
Polish writes new versions of your headlines and CTAs, tests them on your real visitors and keeps the ones that win.
Start free